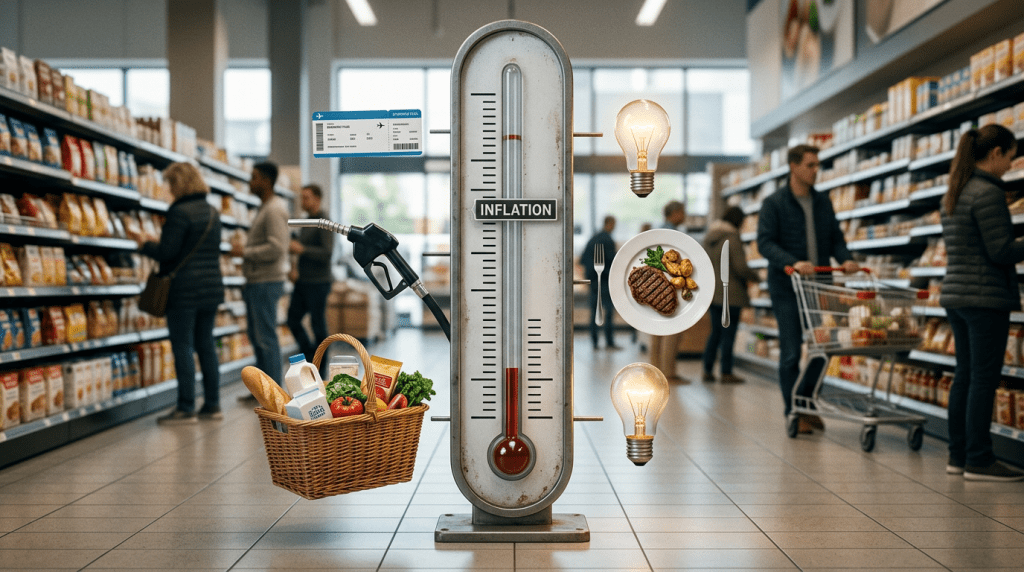
Your personal inflation rate is how much your cost of living rose based on where your money actually goes. The official number — 3.4% in July 2026, according to the Bureau of Labor Statistics — describes an average urban household. If your budget doesn’t look like that average, your number doesn’t either.
That’s not our interpretation. The BLS says it in its own documentation: “The CPI does not necessarily measure your own experience with price change.”
Prices rose 0.1% in July from June, and 3.4% from a year earlier. Inside that 3.4%, categories moved in opposite directions — and each one carries a different weight in your budget.
The average hides big differences
The Consumer Price Index tracks a basket of goods and services. Each category enters the calculation with a weight, based on how much of the average urban household’s spending it represents.
That weight column is the one almost nobody publishes, and it’s the one that changes how you read the report:
| Category | July vs. June | vs. a year ago | Weight in index |
| Shelter (rent and equivalent) | +0.1% | +3.2% | 35.3% |
| Groceries | −0.1% | +2.7% | 8.2% |
| Restaurants | +0.3% | +3.4% | 5.3% |
| Gasoline | −2.9% | +24.6% | 3.9% |
| Electricity | +0.1% | +4.2% | 2.6% |
| Airfares | +2.2% | +25.5% | 1.1% |
Source: U.S. Bureau of Labor Statistics, Consumer Price Index, July 2026. Relative importance as of June 2026.
Airfares rose 25.5% in a year. It’s the loudest number in the table, and it’s 1.1% of the index. Shelter rose 3.2% and carries 35.3% — more than a third of the entire calculation.
That’s why the headline index moved just 0.1% in July: the BLS attributes roughly two-thirds of that monthly increase to shelter.
A big jump in a small category barely moves the number. A small jump in shelter moves everything.
Your budget probably isn’t the average budget
The index weights shelter at 35.3% because that’s how the average urban household spends. Yours may look different, and federal data shows which direction.
According to the BLS Consumer Expenditure Survey (2022), the average Hispanic household spent 5.7% of its budget on gasoline and other fuels, versus 4.3% for the average U.S. household. On transportation overall: 19.6% versus 16.8%. And 52% of Hispanic households were renters, versus 35% of all households.
There’s a work reason behind the gasoline number. Latinos made up 19% of the labor force in 2023, but 52% of construction laborers, 52% of maids and housekeeping cleaners, and 50% of landscaping and groundskeeping workers, according to the BLS. Those are jobs you show up for in person.
That’s where the average breaks down. Gasoline rose 24.6% over the year. If you drive every day because your job can’t be done in front of a computer, that 24.6% isn’t a line in a report — it’s your tank, and you have little room to avoid it.
Calculate your personal inflation rate in 4 steps
You don’t need to replicate the BLS methodology. You need your own weights.
- Pull your percentages. Review your last three months of spending and work out what share of your total goes to each big category: rent, transportation, groceries, utilities, eating out, and everything else.
- Write down each category’s annual change. Use the “vs. a year ago” column above.
- Multiply and add. Each percentage by its annual change. Add up the results.
- Compare it to the official 3.4%.
Say you earn $48,000 a year and spend about $3,000 a month:
| Category | Your spending | Annual change | Contribution |
| Rent | 40% | +3.2% | 1.28 |
| Transportation and gas | 15% | +24.6% | 3.69 |
| Groceries | 20% | +2.7% | 0.54 |
| Utilities | 8% | +4.2% | 0.34 |
| Eating out | 7% | +3.4% | 0.24 |
| Everything else | 10% | +3.4% | 0.34 |
| Your personal inflation rate | ≈ 6.4% |
Nearly double the official 3.4%. Three percentage points of difference on $3,000 of monthly spending comes to about $90 a month — close to $1,080 a year — that the headline doesn’t capture.
The number is an approximation and doesn’t pretend otherwise: it uses your weights instead of the average household’s. For deciding where to adjust, that serves you better than the figure on the news.
If inflation is slowing, why does everything still feel expensive?
Inflation slowing down doesn’t mean prices are coming down.
If something cost $100 and rose to $110, then starts rising more slowly, it still costs $110. What changed was the speed, not the price.
July had both at once. Groceries fell 0.1% and gasoline dropped 2.9% during the month — real monthly declines. But gasoline was still 24.6% more expensive than a year earlier.
And in June the headline index had fallen 0.4%. Two straight months of soft data, with the tank still far more expensive than last summer.
Why gas prices don’t fall when oil does
What to do with your number
The percentage on its own does nothing. It’s useful for ordering three decisions:
Where does most of it go? If rent is 40% of your spending, that’s where the pressure is and that’s where your leverage is. Cutting coffee doesn’t move a needle that weighs 40%.
What’s rising fastest among the things that actually weigh something? A 24.6% increase in a category that’s 15% of your budget costs you more than a 25.5% increase in one that’s 1%.
What can you actually decide on? If you drive 40 miles a day to work, gas is a cost you plan around, not one you cut. If eating out has grown to 15% of your spending, there’s room there.
Understanding your personal inflation rate doesn’t mean cutting every time a price goes up. It means knowing which of those increases are actually costing you money and which ones just sound alarming.
Inflation is national. Its impact is yours.
With Finhabits, you can organize your finances, set goals and build better money habits.
Sources
U.S. Bureau of Labor Statistics — Consumer Price Index, July 2026 (USDL-26-1378), released August 12, 2026.
U.S. Bureau of Labor Statistics — Consumer Price Index: Questions and Answers.
U.S. Bureau of Labor Statistics — Consumer Expenditure Surveys, 2022: Hispanic or Latino origin of reference person.
U.S. Bureau of Labor Statistics — Labor Force Characteristics by Race and Ethnicity, 2023.
Disclaimer
This material is provided for informational purposes only and is not intended to offer investment, legal, or tax advice. All images and figures are for illustrative purposes. Investment advisory services are offered through Finhabits Advisors LLC, a registered investment advisor with the SEC. Registration does not imply a certain level of skill or training. Past performance is not indicative of future returns. All investments involve risk, including the possible loss of principal. Securities are offered through Apex Clearing Corporation, Member of FINRA, SIPC. Securities held at Apex are protected up to $500,000, which includes a $250,000 cash limit. See SIPC.org for more details.
© Finhabits, Inc. All rights reserved.